5/10 Real data at last
Where actual results are presented. The root velocity profile appears stable as a waterfall
The week before last, although mostly a bye week thanks to scarpering off to France to visit friends, I was in on Monday and Tuesday. I had seedlings for those days on a different set of scrounged plates, prepared just before I realized I ought be making my own plates. These plants seemed to be growing fine so I made some movies. Then last week I spent much of my time analyzing them.
The first thing I determined was that root growth rate was ok, not perhaps quite as speedy as I’d like but far better than on the velocity atrocity day. I decided to calculate the velocity profile every ten minutes. Because I had imaged each root over the course of an hour, this would give me seven profiles. I took images every minute and thus could have 61 profiles, and calculating time for each profile is a few seconds; nevertheless, there is a fair amount of manual busy work that needs to be done for each profile, both before and after calculation, so seven represents a good compromise, particularly to get going. Here is a set of profiles for a root:
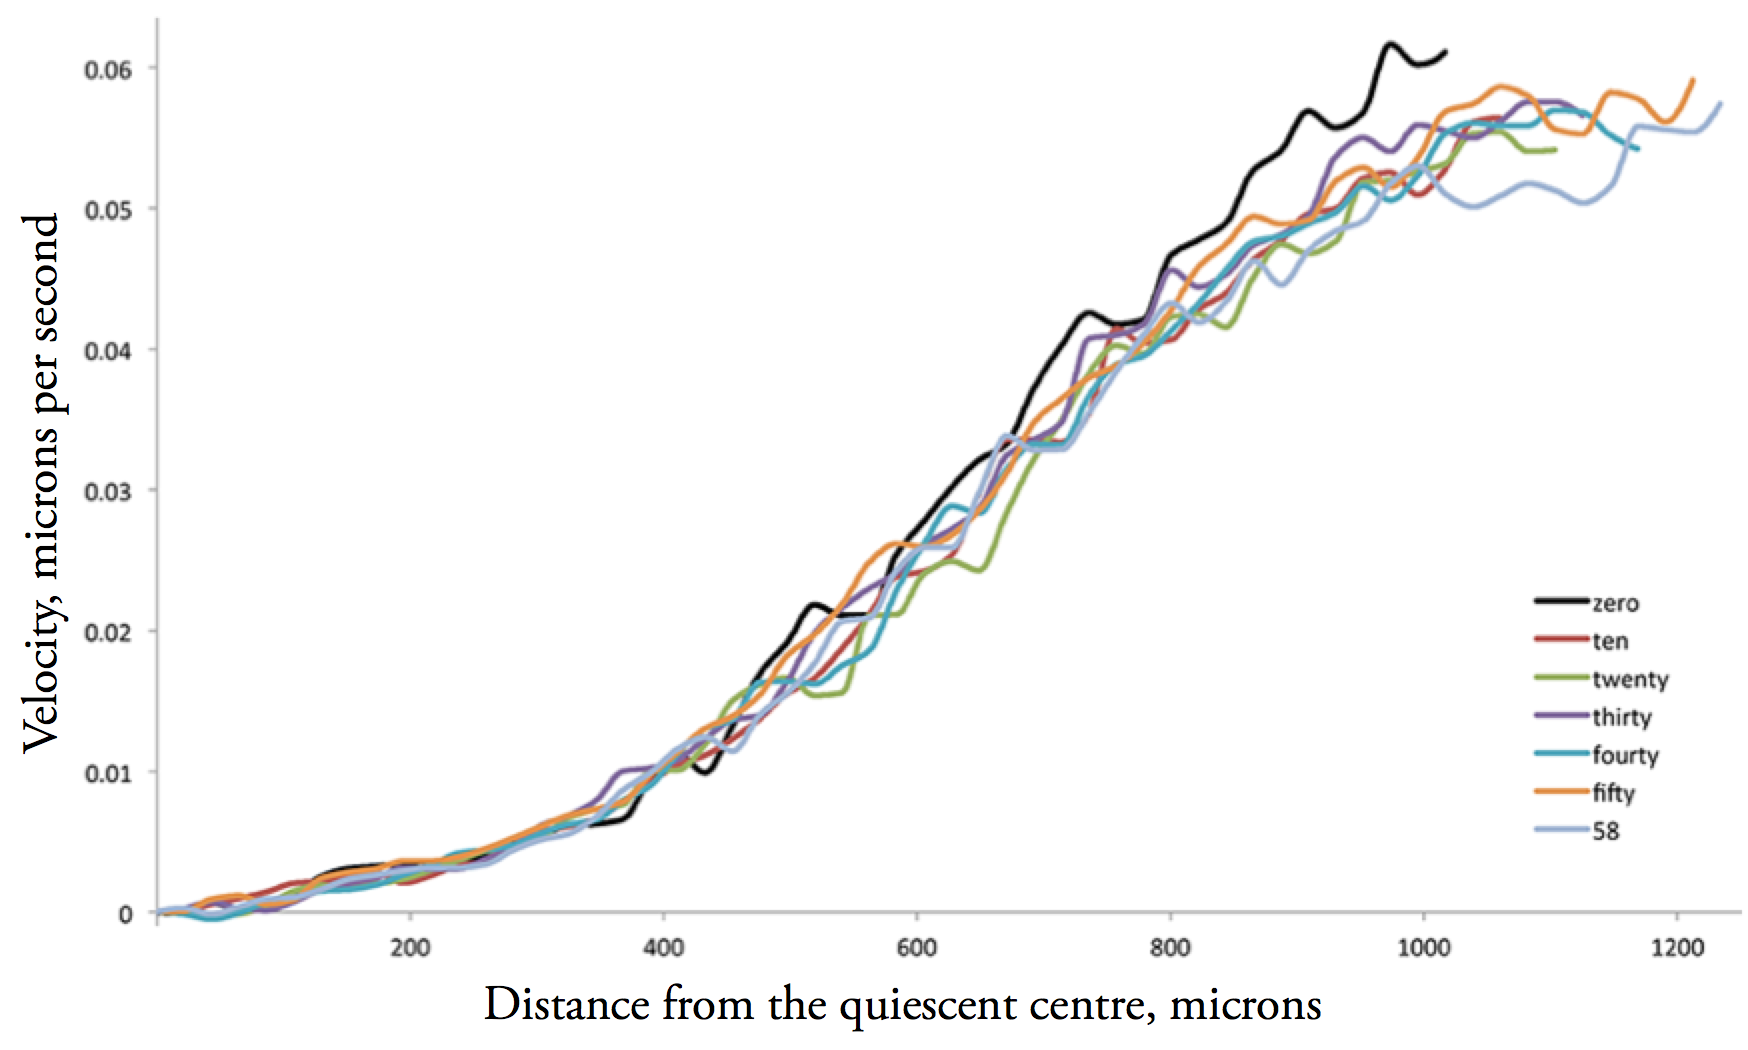
Velocity profiles every ten minutes for a lab weed root
These are velocity profiles. You remember what these are? No? Then go back and read the post from two weeks ago where these are lovingly explained. The profiles are closely superimposable. There is some wobble and spread after 500 microns or so, and the black line looks notably divergent after about 750 microns. But there does not seem to be any coherent temporal change. That is to say the difference in the profiles seem random with respect to time. It is stable within the precision of the measurement.
This is cool. The tricky thing here is that although the profile is static, cells are moving through it. A cell at 400 microns from the tip at time zero would be at about 440 microns after the hour. If the profile were following cells then it should be displaced with the cells, and hence there would be a regular shift of the profiles (with respect to the x-axis). The shift could not continue indefinitely but one could imagine a shift lasting an hour or so followed by a snapping back. Indeed, I did imagine that because oscillatory systems are common in regulatory circuits (as a thermostat causes room temperature to oscillate around the set point, as the heat comes on goes off). But if the profile position is oscillating then the oscillations are small. The profile appears stable to the passage of cells through it, like a waterfall to the passage of water.
Now, to be sure, 40 microns is not such a large distance in the graph, more or less the bandwidth of the group of lines. So far, I have analyzed four different roots and they all look the same. There are occasional deviations, like the black line in the figure above, but nothing that looks like a pattern of change over time.
One thing that I need to do is to push the resolution of the method as far as possible. Another thing is to follow a root for more time, say two or three hours. The latter is a bit tricky because the microscope is just hanging out in the lab, meaning that the environmental conditions could fluctuate and induce growth profile changes for that reason. I will try it anyway.
Still, this is not so bad for a first set of real data.